Posting below an attempt to value defensive ratings using runs saved. I haven't built this into my projection system yet, but I intend to.
This is calculated as follows:
1. I built a two-team league with everyone 50 rated (on the 1-250 scale I took that as 101 and on the 1-600 scale 404). The idea as to make everyone the same and everyone about average. All players on Team A and Team B are based on two templates, 'clone hitter' and 'clone pitcher'.
2. I ran 100k games in the simulation engine between Team A and Team B to identify the runs scored per game, and per 162 games, by each team
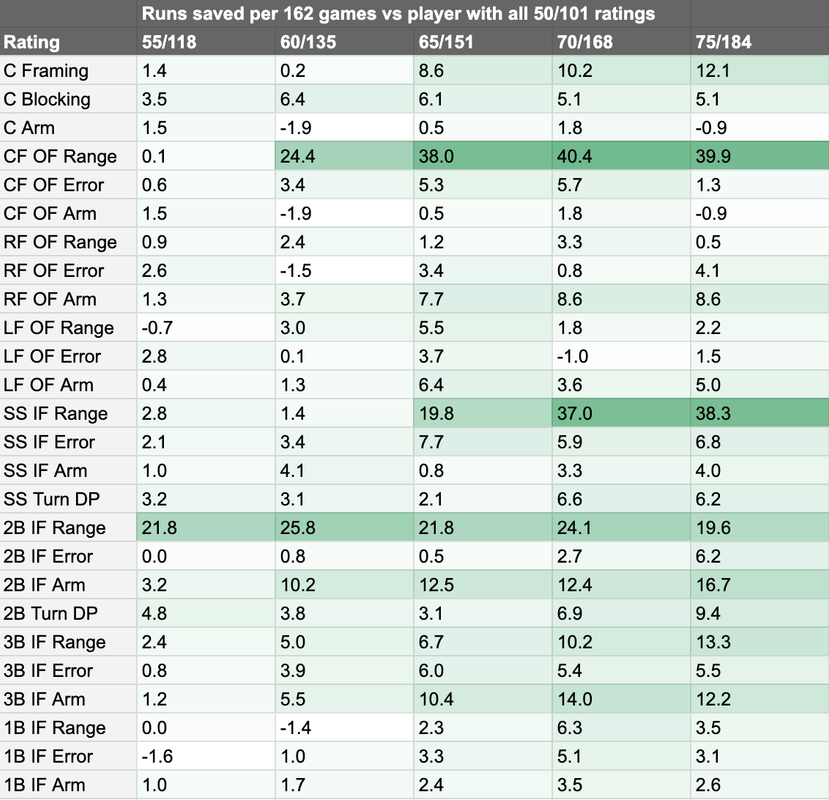
3. I then varied ONE player on Team A with defensive attributes. So make the player the catcher and varied framing from 50 to 55. On the 1-250 scale that was a move from 101 to 118.
4. I then reran the 100k simulation and logged the number of runs saved by the team with the better catcher, per 162 games played.
5. I then did this for every defensive metric. The summary of all of this is in the table below