 |
|
Latest News:
OOTP 27 Buy Now
- FHM 12 Available
- OOTP Go! 27 Available
Out of the Park Baseball 27 Buy Now! |

|
|
||||
| ||||
 04-30-2012, 09:16 AM
|
#101 | |
|
Hall Of Famer
Join Date: Mar 2002
Location: Ontario, Canada
Posts: 2,436
|
Quote:
RATINGS: 80% CURRENT YEAR: 15% PREVIOUS YEAR: 4% 2 YEARS AGO: 1% Sabermetric Lineups BATTER AGING: .250 BATTER DEV: 1.000 PITCHER AGING: .375 PITCHER DEV: .875 INJURIES: OOTP Classic TALENT CHANGE RANDOMNESS: 67 |
|

|

|
|
04-30-2012, 09:20 AM
|
#102 | |
|
Minors (Triple A)
Join Date: Jun 2011
Posts: 221
|
Quote:
|
|
|
|
|
|
04-30-2012, 11:46 AM
|
#103 |
|
All Star Reserve
Join Date: Nov 2008
Posts: 586
|
Eiskrap is there any way you can measure the top 100-150 hitters and breakdown the age demographic?
|
|
|
|
|
04-30-2012, 11:55 AM
|
#104 |
|
Major Leagues
Join Date: Mar 2002
Posts: 373
|
Thank you for all the work. But I'm concerned that there aren't any measurements for pitching. The numbers look good for hitting and plate appearances, but Skydog could you provide some pitching data for Eiskrap to graph?
|
|
|
|
|
04-30-2012, 12:14 PM
|
#105 |
|
Major Leagues
Join Date: Jan 2002
Posts: 336
|
I also wanted to say thank you to everybody for their hard work.
One major concern I have about putting the AI Evaluation consideration of Ratings so high is that when it comes time for contract offers, players who put up bad numbers will still be asking for tons of $$$$$$$ I always preferred for everybody (myself and the AI) to emphasize stats over ratings (at least most recent stats). I'm not crazy about the idea of having ratings so highly emphasized. I understand your reasoning behind it, but 80% seems high. |
|
|
|
|
04-30-2012, 01:11 PM
|
#106 | |
|
Front Office Football Central
Join Date: Feb 2002
Location: Souf Cackilacky
Posts: 1,762
|
Quote:
|
|
|
|
|
|
04-30-2012, 01:42 PM
|
#107 | ||
|
Minors (Triple A)
Join Date: Jun 2011
Posts: 221
|
Quote:
Quote:
|
||
|
|
|
|
04-30-2012, 02:27 PM
|
#108 |
|
Minors (Triple A)
Join Date: Jun 2011
Posts: 221
|
I decided to check it for myself. Here's a graph comparing the top 100 in VORP from that file to MLB's top 100 in batting VORP from 2011. It's not showing multiple years like the previous person did but it at least shows that this data is close to matching up to current real life. The development portion seems spot-on but there might be a tad too many older guys in comparison to current MLB (granted, just one year of data).
 Edit: Added a second chart to show age ranges to better visual how there's a few too many talented old players in that particular year versus 2011. Not saying it's a huge flaw in these settings necessarily though. 
Last edited by luger; 04-30-2012 at 03:04 PM. |
|
|
|
|
04-30-2012, 07:51 PM
|
#109 |
|
Front Office Football Central
Join Date: Feb 2002
Location: Souf Cackilacky
Posts: 1,762
|
|
|
|
|
|
05-01-2012, 11:12 PM
|
#110 |
|
Major Leagues
Join Date: Mar 2002
Posts: 373
|
Eiskra,
When you get a chance is there a thread that you could point to that explains how you are able to graph the data? Also, I'm interested in how you coordinated the data out of OOTP and compared it to the data out of the Lahman database. Thanks. |
|
|
|
|
05-01-2012, 11:49 PM
|
#111 |
|
Minors (Triple A)
Join Date: Jun 2011
Posts: 221
|
If you add the Data Analysis add-on to Excel and choose the Histogram function, it will put the nice format so you can run the Scatter line chart to get those graphs. Lehman's database can be downloaded in a CSV format so you can open it in Excel as well.
That's how I did my chart above and I assume Eiskrap used a similar procedure though I'm sure he'll chime in if he did something different. |
|
|
|
|
05-02-2012, 04:01 AM
|
#112 |
|
Minors (Rookie Ball)
Join Date: Feb 2007
Location: London, England
Posts: 29
|
I've attached my template here if you want to do something similar.
All the Lahman data is already in there so all you have to do is export the csv files from the game. Filter them to just just be the Major league data and years you are interested in. Paste the players data in to the Master tab, career batting stats in to Batting Stats and career pitching stats into Pitching Stats. The last thing is to make sure the formula in columns AF:AG of the batting stats and AY:AZ of the pitching stats reach the bottom of the pasted data. After its calculated the graphs should be on the final two tabs. Should only take 5 minutes and is a useful check. |
|
|
|
|
05-02-2012, 07:34 PM
|
#113 | |
|
Major Leagues
Join Date: Mar 2002
Posts: 373
|
Thanks Eiskrap. But I must be missing something from your post. I do not want this to turn into an excel explanation as I consider myself pretty good, as I understand and can do pivot tables, but this statement is not in your template that you provided:
Quote:
I will list out my steps that I took, so maybe you can point out what I did wrong. 1. Downloaded attached template 2. Turned on editing and saved as (not a 97-03 excel format because of loss of features) but instead as Microsoft office 2010 excel document. 3. The Batting Stats, Pitching Stats and Master tabs are completely blank. 4. I go to my league and select the Export Data to CSV files. 5. I then open the Players.csv file, create a new tab. I copy and paste into the Masters tab in your spreadsheet. 6. I then open players_career_batting_stats.csv and I again create a new tab. I then filter the League Id to only be of value 100 (MLB League Id). I then do a date between 2012 through 2032 for the years I want of the MLB specific player career batting stats. I finally filter the split id for only value of 1 (as I do not include left/right splits) and I then copy and paste this data into the new tab created. I then copy and paste the data out of the new tab and paste it into the Batting Stats tab of your spreadsheet. I will stop here so it does not get much longer, but what did I do wrong or what is the next step specifically. After doing all the above, this is what I see in Batting Charts tab. 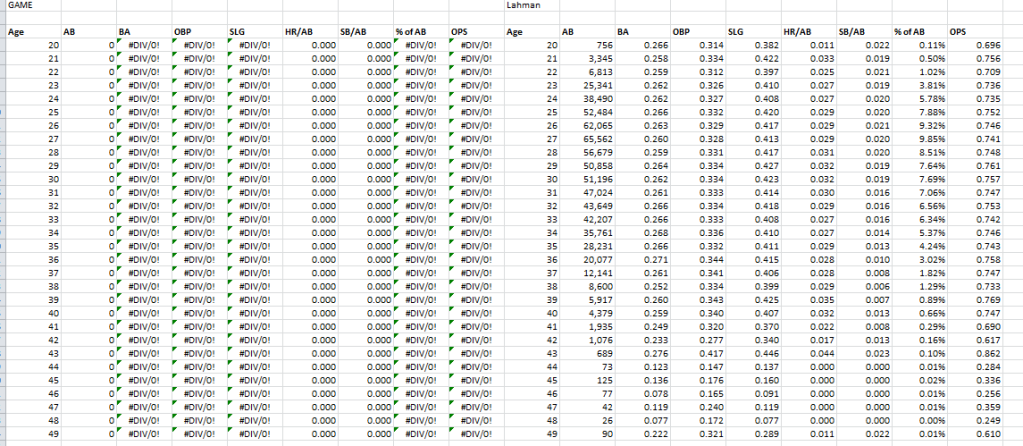
Last edited by SunDevil; 05-02-2012 at 08:35 PM. |
|
|
|
|
|
05-02-2012, 09:47 PM
|
#114 |
|
Hall Of Famer
Join Date: Dec 2003
Location: LEO
Posts: 3,789
|
perhaps you copied and pasted formulae rather than data? Right click->Paste Special->Paste Values
__________________
The Chicago White Sox 1906, 1917, 2005 World Series Champions 1900, 1901, 1906, 1917, 1919, 1959, 2005 American League Champions 2000, 2005, 2008 American League Central Division Champions 1983, 1993 American League West Division Champions OOTP | Orbiter | SSMS | FSX | LoL | MLP:FIM! |
|
|
|
|
05-02-2012, 10:58 PM
|
#115 |
|
Major Leagues
Join Date: Mar 2002
Posts: 373
|
Nope.
|
|
|
|
|
05-02-2012, 11:23 PM
|
#116 |
|
Major Leagues
Join Date: Mar 2002
Posts: 373
|
So I figured out what I did wrong and it was a stupid mistake. I was copying over the columns AF and AG and wiping out the age and year of birth formulas. Everything showed up. Thank you again for sharing your template.
Last edited by SunDevil; 05-03-2012 at 08:39 AM. |
|
|
|
|
05-04-2012, 05:57 PM
|
#117 |
|
Major Leagues
Join Date: Jan 2002
Posts: 336
|
I'm wondering where do you guys find the statistics to put into the chart template? Like where do you gather the data from within OOTP?
|
|
|
|
|
05-05-2012, 04:51 PM
|
#118 | |
|
Major Leagues
Join Date: Mar 2002
Posts: 373
|
Quote:
First test simmed 20 years till the end of the 2032 season 25/25/25/25 AI evaluation ratings : highest contract $52 million a year. This was a long term contract and it was the in the last year. The contract started at $26 million and escalated in the 7th year (last year) of the contract to $52 million. Top 5 $52 million $50 million $48 million $46 million $40 million Second test simmed 20 years till the end of the 2032 season 80/15/4/1 AI evaluation ratings: highest contract $40 million a year. This was a long terms contract and it was the last year. Top 5 $40 million $36 million $36 million $32 million $32 million I was not expecting this result because I agree with Mets man that I thought the ai would be giving out bigger contracts with the rating so heavily focused. Not really conclusive with it only being 2 20 year tests but I thought I would report what I saw. |
|
|
|
|
|
05-05-2012, 04:55 PM
|
#119 | |
|
Major Leagues
Join Date: Mar 2002
Posts: 373
|
Quote:
This button is located in the bottom right hand corner of the League Setup screen. Then you want three files: players.csv Import all the players as some MLB players over the years end up in the minors when they retire, but you need their info so copy everyone over into the template. players_career_batting_stats.csv players_career_pitching_stats.csv Filter them for the league id of 100 (MLB) and the split id of 1 (which is combined left and right handed) and then you need to filter the years. For my two tests I did a filter on the years by doing a between statement of 2012 and 2032. |
|
|
|
|
|
05-08-2012, 01:09 AM
|
#120 | |
|
Major Leagues
Join Date: Jan 2002
Posts: 336
|
Quote:
I only see the ABs, AVG, OPS for batters and IPs, ERA for pitchers. |
|
|
|
|
 |
| Bookmarks |
|
|


